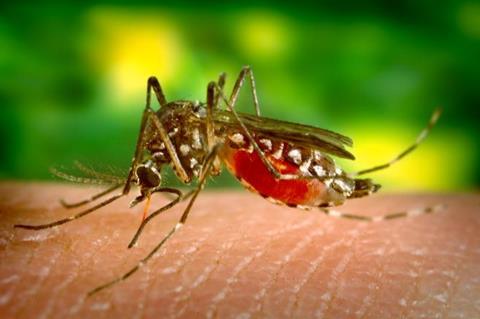
Researchers have analyzed data from Mexico’s Ministry of Health to identify dengue fever hotspots, calculating environmental and socioeconomic risk factors and mapping areas where severe outbreaks occur.
As many as one in five dengue fever deaths in the Americas occur in Mexico, and the rate of the disease’s severity has been increasing for decades, according to the World Health Organization. Now, a Rutgers researcher has generated data that could help curb the mosquito-borne illness in the country.

Ubydul Haque, an assistant professor of global health at the Rutgers Global Health Institute, has analyzed data from Mexico’s Ministry of Health to identify dengue fever hotspots. Working with epidemiologists at the University of North Texas and Universidad Autónoma de Nuevo León, the team calculated environmental and socioeconomic risk factors and mapped areas where severe outbreaks occur.
The findings are published in the journal Ecological Informatics.
“These maps can aid health officials in targeting fogging activities or enhancing surveillance,” Haque said. “By knowing where severe dengue fever frequently occurs, we can significantly reduce the number of cases.”
Socioeconomic status
Dengue fever has been reported in 28 of 32 states in Mexico, and researchers have long known that socioeconomic status and weather affect dengue fever case counts in those states. But the factors contributing to disease severity haven’t been studied.
Past work also has failed to account for geographic distribution of variants, or serotypes. There are four dengue virus serotypes – DENV-1, DENV-2, DENV-3 and DENV-4 – and transmissibility and lethality differ by each.
To fill these research gaps, Haque analyzed laboratory-confirmed dengue fever infections from 71,059 individuals in 2,469 Mexican municipalities collected between 2012 and 2020. Samples included serotype classification.
This data was overlaid with localized weather and socioeconomic statistics, such as literacy, access to health services, electricity and sanitation.
Rising humidity
As expected, each degree Celsius increase in temperature was associated with lower rates of occurrence of the virus – mosquito eggs don’t hatch well in high heat – while increasing humidity was associated with an increase in the rate of each virus serotype.
Moreover, the researchers determined that lower socioeconomic status increases risk of dengue fever, and indicators such as access to education, information and infrastructure are better predictive factors of dengue fever distribution.
From this data, the researchers produced heat maps highlighting dengue virus distribution and severity. Hotspots were generally observed in humid coastal regions at lower altitude. Throughout the country, the most prevalent serotype was DENV-2 and the least prevalent was DENV-4, Haque said.
While efforts are underway to develop DENV-specific vaccines, mosquito control programs such as fogging, and drone surveillance remain the most effective means of slowing the disease’s spread. Haque said data visualization can help health officials plan where to target their activities.
“From our data we know that DENV-2 is deadlier compared to other serotypes,” Haque said. “If regional health officials had limited resources for their control program, they could focus most of their resources in places where DENV-2 was prevalent.”
The WHO estimates dengue fever infects as many as 400 million people every year, killing thousands. With climate change predicted to increase dengue fever cases in Mexico over the coming decades, continuous surveillance of serotype patterns will be essential to preventing or slowing the rate of increase, Haque said.


No comments yet